 Skip to content
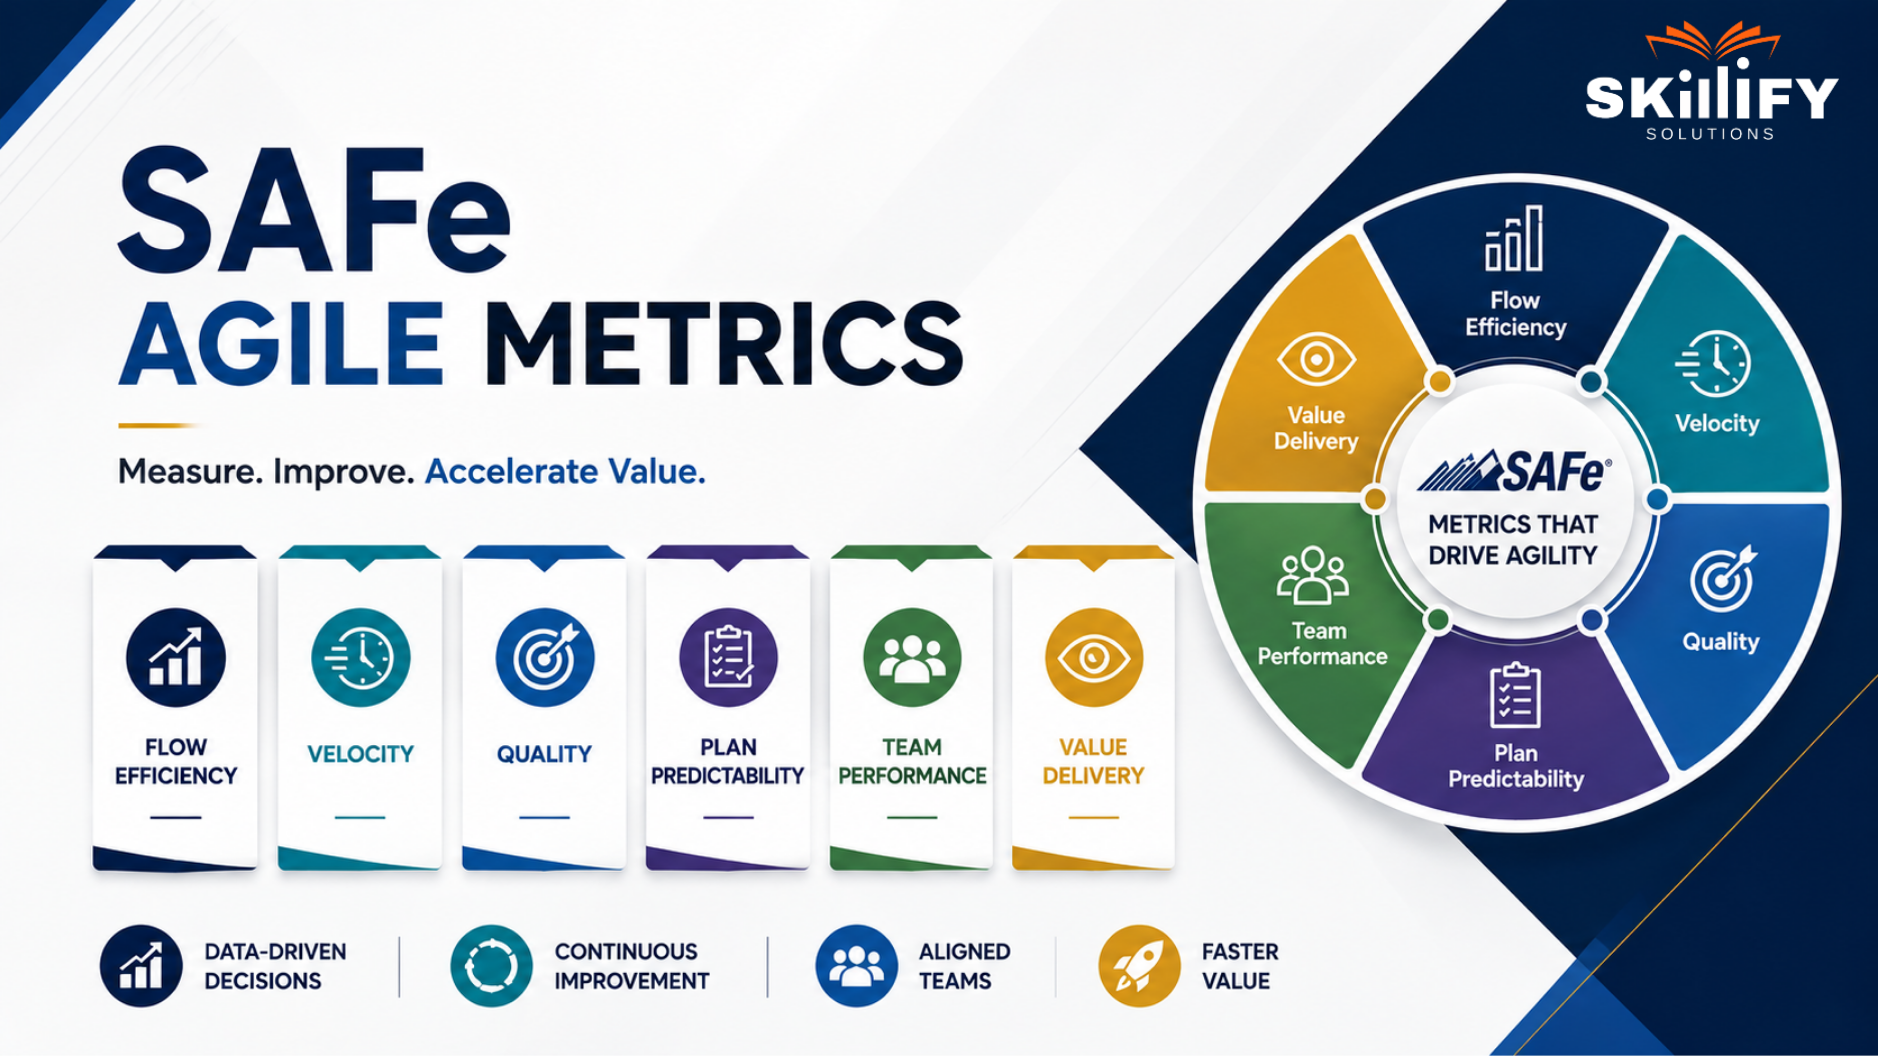
Key Highlights of SAFe Agile Metrics
- Learn the essential SAFe Agile Metrics for measuring enterprise Agile success.
- Understand the six SAFe flow metrics that optimize value delivery.
- Explore flow metrics SAFe framework uses to improve ART performance.
- Discover key SAFe metrics and KPIs for better business outcomes.
- Track Agile Release Train metrics to improve predictability and flow.
- Master SAFe KPIs for Agile teams and SAFe performance metrics effectively.
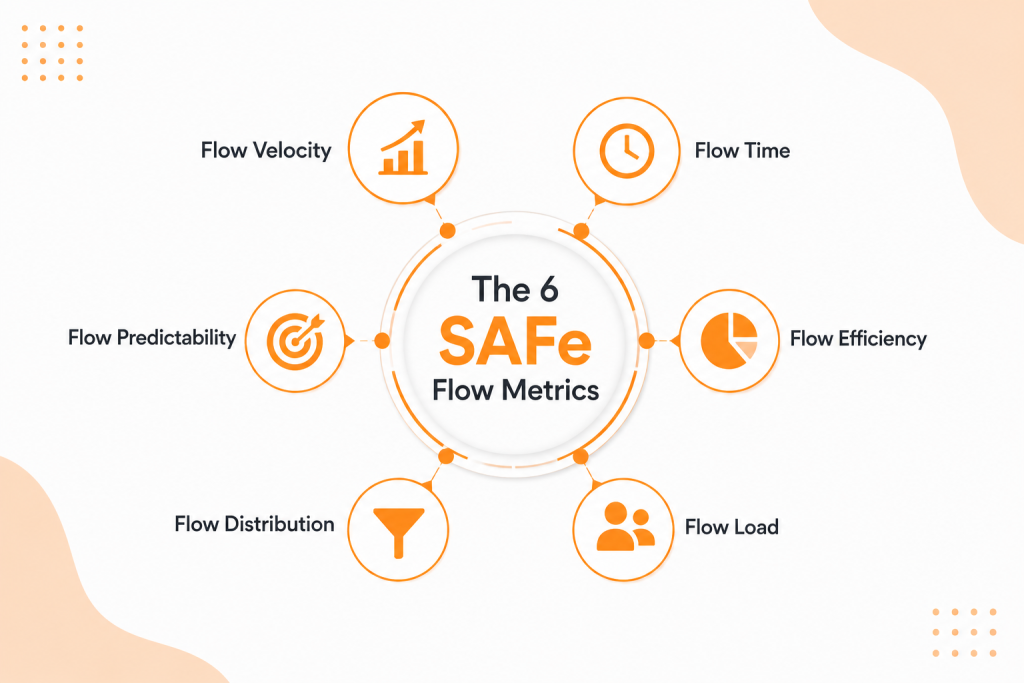
The most important SAFe Agile Metrics are the six Flow Metrics. They are Flow Velocity, Flow Time, Flow Efficiency, Flow Load, Flow Distribution, and Flow Predictability. Together, they reveal how effectively your Agile Release Train (ART) delivers value, not just how much work gets done.
Teams proudly celebrate high velocity while wondering why releases are still delayed and customers keep waiting. The problem is measuring the wrong things. Velocity tells you how busy a team is, but it doesn’t show where work gets stuck, why delivery slows down, or whether the ART is actually creating value.
That’s exactly why SAFe introduced Flow Metrics. They shift the conversation from How much did we finish? And how smoothly is value flowing? In this blog, you’ll learn what each metric measures, the warning signs to watch for, and how leading SAFe organizations use them to improve predictability, reduce bottlenecks, and deliver business value faster.
What Are SAFe Agile Metrics?
SAFe Agile metrics are standardized measurements that help organizations evaluate how effectively Agile Release Trains (ARTs) deliver value. Instead of focusing only on team output, SAFe measures business outcomes, workflow efficiency, and organizational competency.
The framework emphasizes Flow Metrics to identify bottlenecks, improve predictability, and accelerate value delivery across the enterprise. These metrics support continuous improvement through regular inspection and adaptation rather than measuring individual or team performance.
If you’re new to enterprise Agile, the Leading SAFe® Certification helps you understand how Flow Metrics, ARTs, and Lean-Agile principles work together to improve value delivery.
SAFe Agile Metrics vs Traditional Agile Metrics
| SAFe Agile Metrics | Traditional Agile Metrics |
| Measure value delivery across the ART | Focus on individual team performance |
| Emphasize Flow Metrics and business outcomes | Primarily track velocity and story points |
| Identify system-wide bottlenecks | Measure sprint-level output |
| Support enterprise decision-making | Mainly used for team planning |
| Encourage continuous improvement | Focus on delivery within iterations |
Become a high-impact Agile leader with the SAFe Scrum Master (SSM) Certification and optimize Flow Metrics across every sprint.
Why Team Velocity Isn’t Enough in SAFe
Team velocity helps individual teams plan their Sprint capacity, but it does not measure ART performance or business value. Since story points vary between teams, velocity cannot be compared across an Agile Release Train.
SAFe instead recommends using Flow Metrics to evaluate delivery speed, predictability, and value flow across the entire system.
To understand how velocity fits alongside other Agile measurements, read our guide on Agile Metrics for Scrum Master, which explains the most important metrics used by Scrum teams.
The 3 SAFe Measurement Domains
SAFe groups Agile metrics into three measurement domains that help organizations evaluate delivery performance, business value, and continuous improvement.
Together, these domains provide a balanced view of how effectively an Agile Release Train (ART) is delivering value.
Outcome Metrics
Outcome metrics measure whether the organization is achieving its desired business results. They focus on customer value, operational performance, and strategic objectives rather than team output.
Common examples include customer satisfaction, business value achieved, revenue growth, quality, and time-to-market.
Flow Metrics
Flow metrics measure how efficiently work moves through the value stream. They help identify bottlenecks, improve predictability, and accelerate value delivery across the ART.
SAFe defines six Flow Metrics that provide visibility into workflow health and delivery performance.
Competency Metrics
Competency metrics assess how well teams and ARTs adopt SAFe practices. They are typically evaluated using the SAFe Business Agility Assessment and Measure and Grow.
It helps organizations identify improvement opportunities across Lean-Agile competencies.
Advance your product leadership skills through the SAFe Agile Product Management (APM) Certification and deliver customer value faster.
The 6 SAFe Flow Metrics
The six SAFe Flow Metrics help organizations measure the speed, efficiency, predictability, and balance of work flowing through an Agile Release Train.
Monitoring these metrics enables ARTs to detect bottlenecks early and continuously improve value delivery.
1. Flow Velocity
Flow Velocity measures the number of Flow Items completed by an Agile Release Train (ART) during a specific period, such as an Iteration or Program Increment (PI).
Why it matters:
- Measures the ART’s delivery capacity
- Helps identify delivery trends over time
- Supports realistic PI planning and forecasting
How to measure it:
Flow Velocity = Total Flow Items Completed per Iteration or PI
Warning signs:
- Declining completed Flow Items
- Large backlog of unfinished work
- Inconsistent delivery across PIs
Teams responsible for PI Planning and ART execution can strengthen these practices through the SAFe Scrum Master (SSM) Certification. It covers iteration planning, flow, and team coordination.
2. Flow Time
Flow Time measures the total time a Flow Item takes to move from request to delivery. It reflects how quickly value flows through the system and helps teams identify delays that slow customer value delivery.
Why it matters:
- Speeds up value delivery
- Highlights workflow delays
- Improves customer responsiveness
How to measure it:
Flow Time = Completion Date − Start Date
Warning signs:
- Increasing lead times
- Long waiting periods
- Slow feature delivery
3. Flow Efficiency
Flow Efficiency measures how much of a Flow Item’s lifecycle is spent in active work versus waiting. It helps organizations identify waste, excessive queues, and unnecessary handoffs across the value stream.
Why it matters:
- Exposes workflow waste
- Reveals bottlenecks
- Improves overall delivery efficiency
How to measure it:
Flow Efficiency = (Active Work Time ÷ Flow Time) × 100%
Warning signs:
- Low active work percentage
- Excessive waiting between stages
- Frequent handoff delays
4. Flow Load
Flow Load measures the amount of work currently in progress (WIP) across an ART. It helps teams understand whether they are taking on more work than they can effectively complete.
Why it matters:
- Prevents excessive WIP
- Reduces context switching
- Improves delivery focus
How to measure it:
Flow Load = Total Active Flow Items (WIP)
Warning signs:
- Too many concurrent Flow Items
- Growing work queues
- Frequent task switching
5. Flow Distribution
Flow Distribution measures how work is divided among different Flow Item types, including Features, Defects, Risks, and Technical Debt. A balanced distribution ensures that the ART delivers new value while maintaining product quality and system health.
Why it matters:
- Balances different work types
- Prevents technical debt buildup
- Supports sustainable delivery
How to measure it:
Flow Distribution = Percentage of Each Flow Item Type Delivered
Warning signs:
- Too many defects
- Increasing technical debt
- Few customer-facing features
The SAFe Agile Product Management (APM) Certification provides practical strategies for managing value delivery effectively.
Flow Predictability
Flow Predictability measures how consistently an ART delivers the business value it commits during a Program Increment. It helps leaders evaluate planning accuracy and build confidence in future delivery commitments.
Why it matters:
- Improves forecasting accuracy
- Increases stakeholder confidence
- Supports reliable PI commitments
How to measure it:
Flow Predictability = Actual Business Value Delivered ÷ Planned Business Value
Warning signs:
- Missed PI Objectives
- Large gap between planned and delivered work
- Unreliable delivery forecasts
SAFe Events That Review Flow Metrics
Different SAFe events provide opportunities to inspect Flow Metrics and take corrective actions. Reviewing the right metrics at the right event helps improve delivery performance and value flow.
| SAFe Event | Flow Metrics to Review |
| Iteration Review | Flow Velocity, Flow Time |
| Iteration Retrospective | Flow Efficiency, Flow Load |
| Scrum of Scrums | Flow Load, Flow Distribution |
| PO Sync | Flow Time, Flow Distribution |
| PI Planning | Flow Velocity, Flow Predictability |
| Inspect and Adapt (I&A) | All six Flow Metrics |
Since Flow Metrics are reviewed during PI Planning, Iteration Reviews, and Inspect and Adapt workshops, it’s helpful to understand how these events work. Explore our complete guide to SAFe Agile Ceremonies.
How to Measure Flow Metrics in Your ART
Follow these steps to begin measuring Flow Metrics across your Agile Release Train:
- Identify the Flow Items you want to track (Features, Defects, Risks, Debt).
- Collect workflow data from your Agile management tool.
- Establish a baseline for all six Flow Metrics.
- Review metrics during PI Planning and Inspect & Adapt workshops.
- Address bottlenecks and continuously optimize workflow based on metric trends.
Accurate Flow Metrics begin with realistic planning. Learn proven sizing and forecasting methods in our guide to Agile Estimation Techniques.
Tools to Track SAFe Agile Metrics
The following tools help organizations monitor SAFe Flow Metrics, visualize ART performance, and support continuous improvement:
- Jira Align: Tracks ART, Solution Train, and portfolio-level Flow Metrics.
- Jira and Flow Framework: Provides dashboards for Flow Velocity, Flow Time, and Flow Load.
- Planview Viz: Visualizes value stream performance and identifies workflow bottlenecks.
- Azure DevOps: Monitors work item flow, cycle time, and delivery trends.
- Digital.ai Agility: Offers enterprise Agile reporting and SAFe performance analytics.
While tools provide visibility into metrics, knowing how to interpret and act on the data is equally important. The Leading SAFe Certification explains how Flow Metrics support data-driven decision-making across the enterprise.
Example: Improving ART Flow Across Two PIs
A software organization’s ART noticed increasing delivery delays during PI 1. Flow Metrics revealed high Flow Load and low Flow Efficiency caused by excessive work in progress and cross-team dependencies.
During PI 2, the ART limited work in progress, reduced handoffs, and balanced Flow Distribution across Features and Defects.
As a result, Flow Time decreased, Flow Efficiency improved, and Flow Predictability increased, enabling the ART to consistently achieve its PI Objectives.
How SAFe Agile Metrics Improve Business Outcomes
SAFe Agile Metrics help organizations move beyond measuring team activity to improving enterprise value delivery. By tracking Flow Metrics, leaders gain actionable insights that drive continuous improvement across the ART.
Key business benefits include:
- Faster value delivery to customers
- Better PI planning and forecasting
- Early identification of delivery bottlenecks
- Improved delivery predictability
- Higher product quality and customer satisfaction
- Data-driven decision-making across the enterprise
Read our Agile Software Development guide to understand how these practices work together to deliver continuous customer value.
Conclusion
SAFe Agile Metrics provide a more complete picture of ART performance than traditional team-based metrics. While velocity remains useful for Sprint planning, it doesn’t reveal how efficiently value moves through the system.
By focusing on the six Flow Metrics, organizations can identify bottlenecks, improve planning, and deliver value more consistently.
Combined with Outcome and Competency Metrics, these measurements support continuous improvement across the enterprise. Regularly reviewing Flow Metrics during key SAFe events and using the right tracking tools enables Agile Release Trains to make informed decisions, optimize workflows, and achieve better business outcomes.
Take the next step in enterprise Agile with the SAFe Certifications and become a certified SAFe transformation leader.
Frequently Asked Questions
1.What is the difference between SAFe Flow Metrics and DORA Metrics?
SAFe Flow Metrics measure how work flows through an Agile Release Train, while DORA Metrics measure software delivery and operational performance, such as deployment frequency and change failure rate
2. Who is responsible for tracking SAFe Agile metrics?
Tracking SAFe Agile metrics is a shared responsibility of Release Train Engineers (RTEs), Product Management, Scrum Masters, Agile Teams, and Lean Portfolio Management.
3. Can SAFe Agile metrics be tracked without Jira Align?
Yes. SAFe Agile metrics can be tracked using tools like Jira, Azure DevOps, Planview Viz, Digital.ai Agility, or even customized dashboards.
4.How often should an Agile Release Train review Flow Metrics?
Flow Metrics should be reviewed regularly during Iteration Reviews, PI Planning, Scrum of Scrums, and Inspect & Adapt (I&A) workshops.
5.What happens if SAFe metrics are used to evaluate individual teams?
Using SAFe metrics to evaluate individual teams can encourage the wrong behaviors and reduce collaboration. SAFe recommends using metrics to improve systems, not judge people.
6.Which SAFe Flow Metric should a new ART measure first?
A new ART should start with Flow Time, as it quickly highlights delays and bottlenecks affecting value delivery.


